Loading...
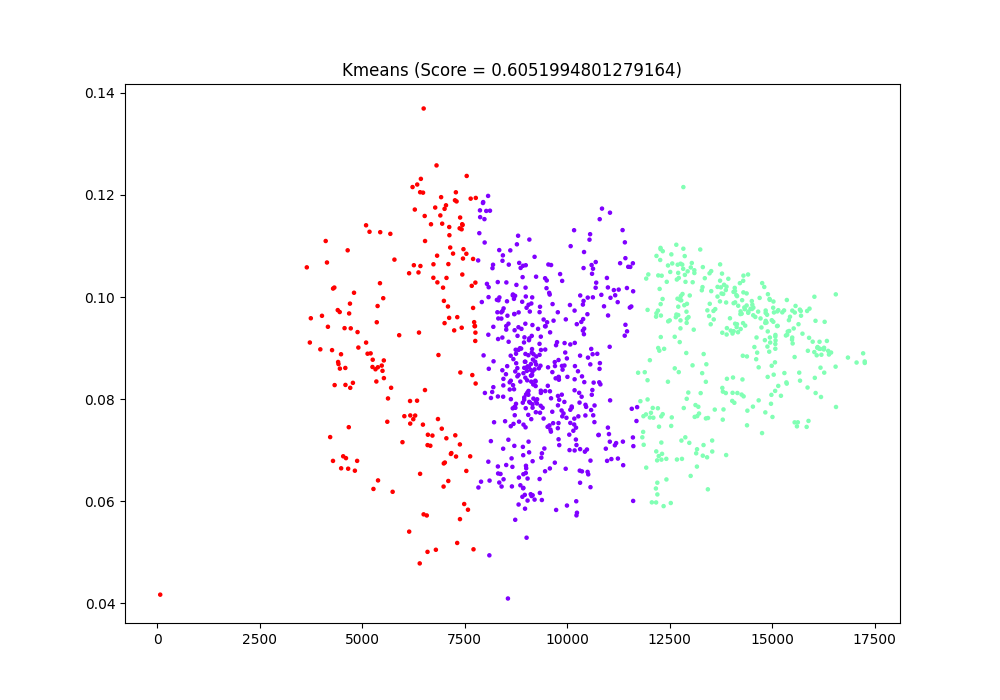
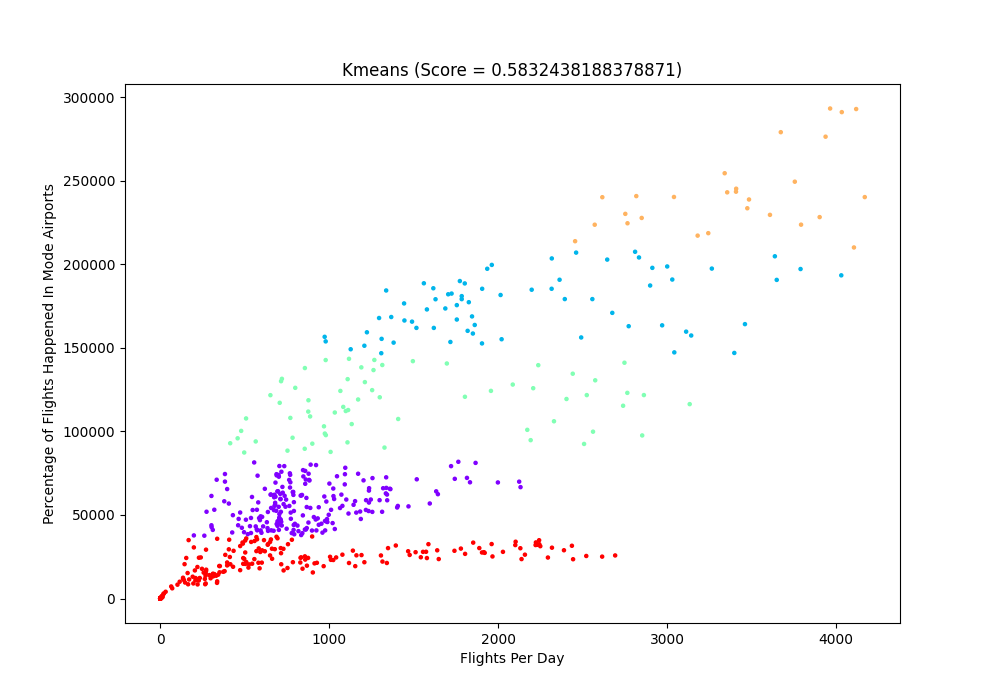
For each dataset, we only display one figures, for more, please refer to Additional Analysis.
We have conducted all four cluster analyses on the opensky dataset. However, since all numeric dataset we got are time series, it can't do cluster by above 4 method. So we do combine several columns into two new columns named 'flights per day' and 'flights happened in Mode airports per day'. But nothing changed, even though we have made out four of them, they seems like meaningless. The only only thing we can tell form the figures is that the 'flights per day' and 'flights happened in Mode airports per day' do key the same correlation at the most the time.

We have conducted all four cluster analyses on the opensky dataset. However, since all numeric dataset we got are time series, it can't do cluster by above 4 method. So we do combine several columns into two new columns named 'new death per day' and 'new cases per day'. But nothing changed, even though we have made out four of them, they seems like meaningless. The only only thing we can tell form the figures is that the 'new deatch per day' and 'new cases per day' do key the same correlation at the most the time.
